One thing that customers have started asking for recently is the ability to create dashboards, to bring charts from various parts of the system together in one place, to share with colleagues and senior management.
Sometimes data from agileBase will be merged or shown alongside data from other places, such as accounting systems.
To allow this, we’ve added a new facility which allows Business Intelligence (BI) reporting applications to connect to agileBase and extract selected data. Bear in mind that when data is exported outside of agileBase, data privacy implications need to be understood.
If your organisation already uses a BI tool such as Microsoft’s Power BI, it can easily be connected. Just let us know and we’ll supply the details you need.
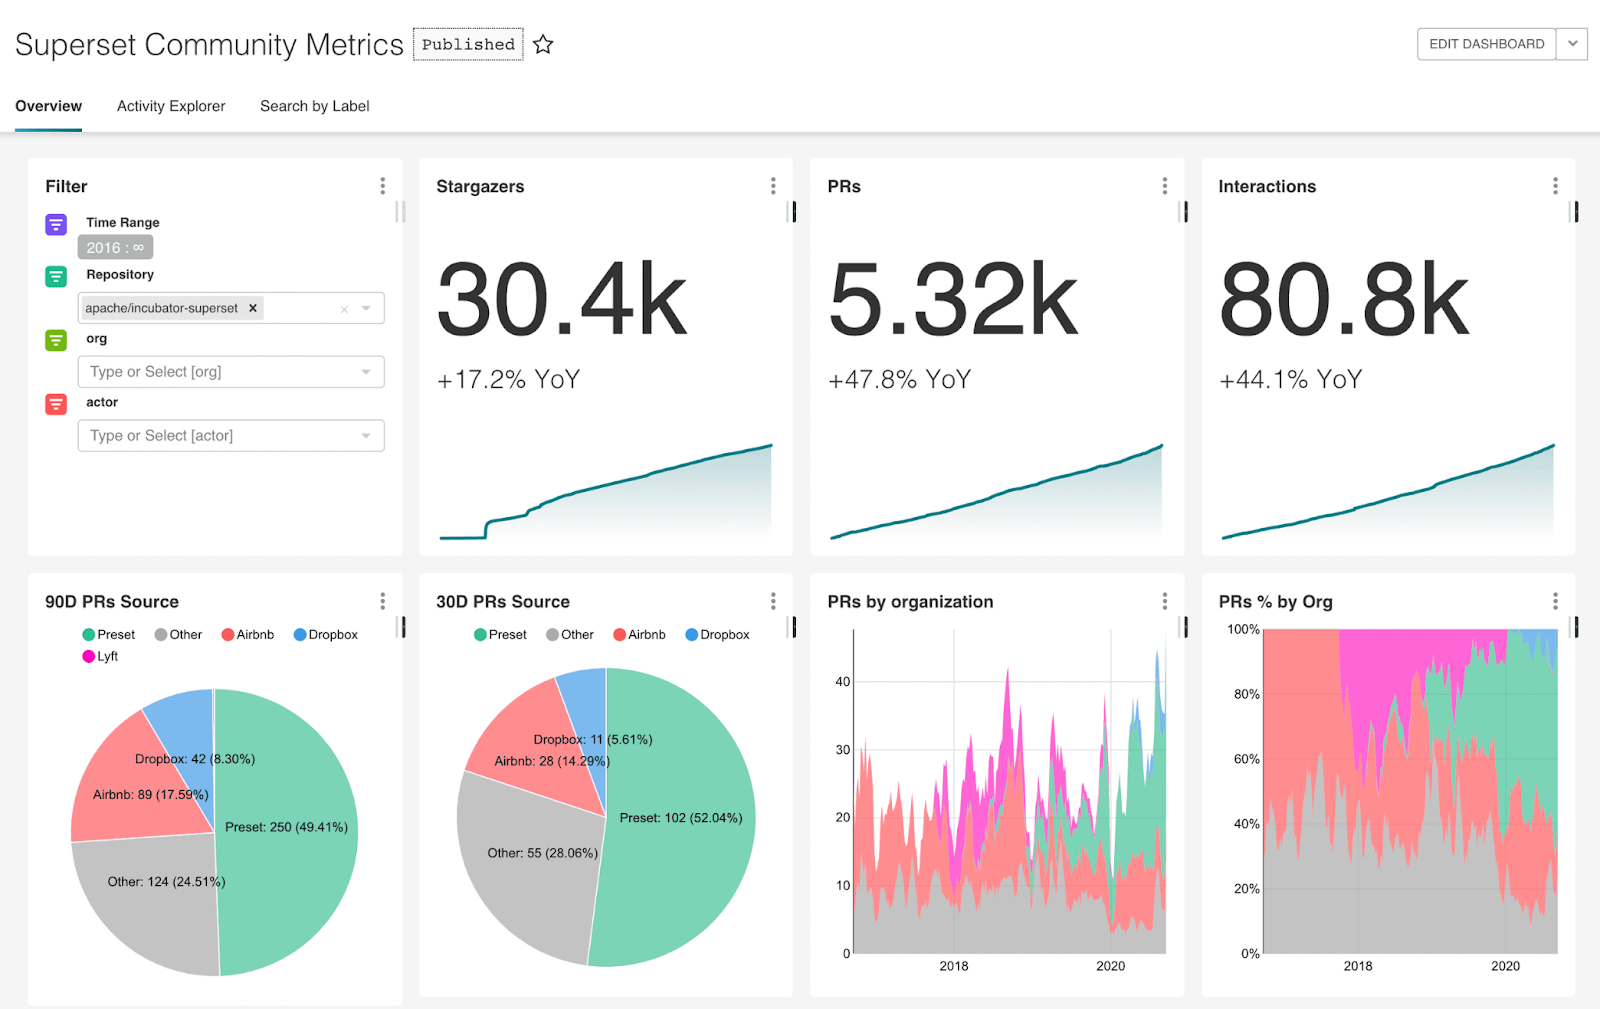
Alternatively, you can utilise the BI tool we provide and host, based on Apache Superset. This is currently in beta testing – if you’d like to join the beta programme please let us know.
Whichever tool you use, you can send the data from any agileBase view to it, by selecting an option in the view’s charting screen. Bear in mind that if you then change a field name, remove a field, or rename the view used in the BI tool, you may then need to re-do any BI charts based on that view.
For more information, please see our charting documentation, which contains an introduction to this topic.
BI reporting can be enabled for a fixed charge of £50/month, covering up to 10 views and an unlimited number (subject to fair use) of BI users (who don’t need to be agileBase users).

Leave a comment