Today’s platform release contains some new features but also the removal of some old unused bits of code. That’s a good thing to do every now and again as it makes the system easier to work on, more bug-resistant and quicker to develop in future.
Without further ado, here’s the rundown of new features added and removed:
Feature additions
- Number scale visualisation
Previously there was an option for number fields called ‘colour outliers’ which worked on number and date fields (but not calculations). It would highlight any ‘out of the ordinary’ values, in other words those that were more than one or two standard deviations away from the mean (maths link).
Thanks to a suggestion from a customer, Sopra Steria, we’ve improved the way numbers are visualised by replacing the colouring with a gauge so you can see the relative scale of each figure.
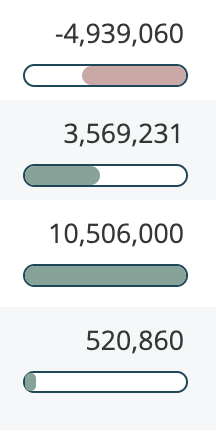
The option to turn this off or on is now called ‘visualise magnitude’.
The maximum value for the purposes of display is still two standard deviations away from the mean, rather than the largest value in the data, otherwise, if the largest value was an outlier it could distort the display. As you can see, negative figures are in red, expanding from the right and positives in green coming from the left.
Percentages are a special case – if a number is detected as a percentage, simply due to the fact the field name has ‘percent’, ‘pct’ or ‘%’ in its name, then the appropriate scale of zero to a hundred will be used.
A number of other improvements in this area have been made as well: Firstly, whenever you enable or disable the option for a field, the data display updates immediately so you can see the impact of your change. Previously, due to caching, you’d have to wait a few minutes, making people uncertain of whether the change had worked.
Secondly, the option can now be used for calculations as well as fields!
Note that the new scale takes effect for numbers but not dates – for dates the previous method of colouring outliers makes more sense, so that’s still used.
- The ability to add filters to individual users as well as roles – thanks to Argenta for requesting this.
Note that most of the time, you’ll probably want to apply filters to roles rather than directly to users:
https://docs.agilebase.co.uk/docs/security-and-compliance/security-features/roles/#multi-tenanting
- Showing workflows which set a field
This is a slightly niche but really useful feature when you need it. When viewing uses for a field, the ‘workflows’ tickbox would show where the field is used by a workflow. It now also shows which workflows set the field, which is a quick way of getting to a workflow you want to edit, if you can’t remember what it’s called.
- A performance tweak for APIs
When someone opens a view, the system calculates statistics for that view, such as averages of numbers, counts of rows etc., for use in the user interface. However if the view is only used by an API that data isn’t necessary, so time is saved by not doing that, speeding up API calls
- Query plan visualisations
In a previous post, we saw how tools like pgMustard could be really useful for figuring out why a particular view might be running slowly and give you tips on how to improve the situation. We said that we plan to add in the facility to send plans to pgMustard directly from Agilebase and that’s now been done.
For now it’s a slightly hidden ‘easter egg’ as it’s mainly useful for people who understand databases in depth – to access it, open a view to the properties panel. Double click anywhere in the panel and a query description with an ‘explain’ button will appear.
- Auto-created tiles and views
When very first setting up a system as a new user, there are a couple of ‘housekeeping’ things you need to do in order to get going.
Usually the first step is to create a table and add some fields to it. However to then see and enter data into that table, another couple of non-obvious steps are necessary. You need to create a tile, to store views, then create a view from the table to put in the tile.
To make things as simple as possible for new users as well as quick for seasoned developers, those last two steps now happen automatically. As soon as you add a table, a tile with the same name is also created. Then upon adding the fifth field to the table, a view is made containing those fields, in the tile.
That quickly gives you a user interface for the structure you’ve created. Of course you can change the tile name or switch to a different one if necessary but it really speeds up prototyping systems.
- Refreshing records
You can now click the record title to refresh the record. Previously a refresh button was in the first tab of the record, but records don’t always have tabs, so using the title is better.
Removals
In preparation for future improvements, a few bits of code have been streamlined.
- Schema tags
A half-finished feature to allow you to add tags to tables, fields, views etc. has been removed to allow us to replace it with a quicker, simpler version of the feature in a future update. Watch this space!
- Comment notification settings
In the early days of Agilebase we introduced a feature to allow people to subscribe to particular tables or users, i.e. always receive on-screen or email notifications when a comment is added in/from them, or conversely to ignore them.
Experience has taught us that it would be better and more useful to be able to subscribe/unsubscribe from charts and chasers or other email notification workflows, rather than manually added comments, so the old system (which there has been no user interface for for some time) has been removed in preparation for that move.
If you’ve any ideas for features you’d like to see added, please do get in touch. We keep a record of everything requested along with numbers of people requesting etc.
Of those improvements requested by customers (as opposed to internally generated), 67% have been implemented so far! So keep them coming.

Leave a comment