Once in a while (a long while hopefully), an emergency occurs and the software that a customer relies on starts failing. Here’s a little write-up of what that’s like, what we can do and how improvements can be made that improve system resilience for everyone.
This isn’t something that people tend to speak about much, or even admit to, but a postmortem on emergency responses is one of the ways in which processes can improve. At the very least, another system administrator reading this who’s experienced something similar will hopefully see that they’re not alone! They may gain some tips, or may even feel like replying with some of their own – please do.
Most of our customers have systems that are mission-critical. That means Agilebase is the engine that runs their businesses, processing orders, managing manufacturing processes and in many cases running the whole organisation from top to bottom.
Some are also fast growing. One of the key benefits of Agilebase as a No Code platform is that it can support customers right the way through from startup to scale-up – you don’t have to throw out systems and replace them as you get bigger.
However once in a blue moon someone pushes the system in a way that hasn’t been anticipated, causing a short term crisis. Whilst this is stressful, I don’t begrudge working on problems like this at all because the solution will help make the system even more robust, reliable and high performance for all future users.
The last time this happened was a few years ago when an organisation started making massive numbers of API calls, due to an ‘infinite loop’ bug in one of their systems, not helped by the fact the business was expanding internationally. API calls are now rate limited, to prevent that reoccurring.
Current issue
The problem I’m writing about today happened with a system that has been steadily growing in scale, complexity and resource usage. Here’s a chart of the number of data changes per month over the past 12 months (a data change is the creation of a record, or editing/deleting one).

Behind these numbers lies the fact that there have been an increasing number of automated workflows and integrations with third party systems, so when a problem does occur there are more places to look for the cause.
In this case, there were a range of problems that started occurring. The main symptom was intermittent ‘seizing up’ of their system. Not everyone was affected but every now and again everything would grind to a halt for many users meaning they couldn’t accomplish their work. This became a serious problem when frequency of occurrence ramped up.
In an emergency situation, events don’t always follow a neat ‘process flow’ of ordered actions, even though in the long run, it would be a goal to have various playbooks for different situations.
There are a number of factors worth talking about though.
Communication
When a customer experiences a serious problem, the first thing they want to know is that you’re on the case! A quick, non-automated response is essential. You can start gathering info such as the perceived severity, the people affected etc. as well as reassuring them that all hands are on deck.
We were very lucky in this case to have a customer who is intimately familiar with their system, having built most of it themselves. As we brainstormed potential causes and solutions they could very quickly help rule things out and report on what recent changes had been made (if any). They were also very understanding and patient and we thank them for that.
As investigations proceed, it’s tempting to delay communications until you have something positive to say. As someone who is not naturally good at real time communications, this is a trap I can easily fall into. However, when the customer representative themselves is getting bombarded by complaints from within the organisation, they need some ammunition themselves and anything that can help them with their own temporary mitigations.
Even if you haven’t been able to rule any more causes out or come up with solutions, a quick regular email along the lines of ‘we’re still investigating the possibilities of X/Y/Z, will send further updates soon’ can be valuable as reassurance and possibly to prompt further ideas.
It’s also great to bring in the rest of your internal team who can provide support and take on some of the communication workload and other tasks.
Initial mitigation
Before even thinking about causes or solutions, it’s worth running through a set of quick checks to see if we can find anything which can cause immediate pain relief. These can be things like
- rebooting systems (e.g. the database server and/or the application server)
- seeing who’s affected and who’s not – maybe there is one user who can carry out actions even when others can’t
- try pausing discrete areas where possible, e.g. integrations with other third party applications
- rolling back any recent system updates (in this case there weren’t any)
In this case we found that a reboot of the database server (as opposed to the application server) allowed people to carry on, even though problems may reappear later. This in itself is useful information pointing to an area where more investigation is necessary. It’s also an action which can be carried out with minimal, if not no impact on other customers.
Investigation
The next step is to get as much data as you can with which to form some hypotheses about causes which can be tested. As well as talking to people and encouraging the customer to try to narrow down affected people/areas/times, various tools can be helpful. In our case
- pg_top – as we’re concentrating on the database, this Postgresql monitoring tool can be very useful, providing real-time usage information. If someone can IM or phone as soon as there’s an issue, pg_top can tell you things like which queries are currently running and how many locks they hold as well as general info like the system load
- Datadog or other similar tools can be used to see usage spikes and also drill into the details of slow queries, or the interaction between different servers and system components
- Agilebase’s own reporting – on larger plans, Agilebase provides very granular reporting of every single action, such as creating a record, running a workflow or loading a view, together with times taken in milliseconds
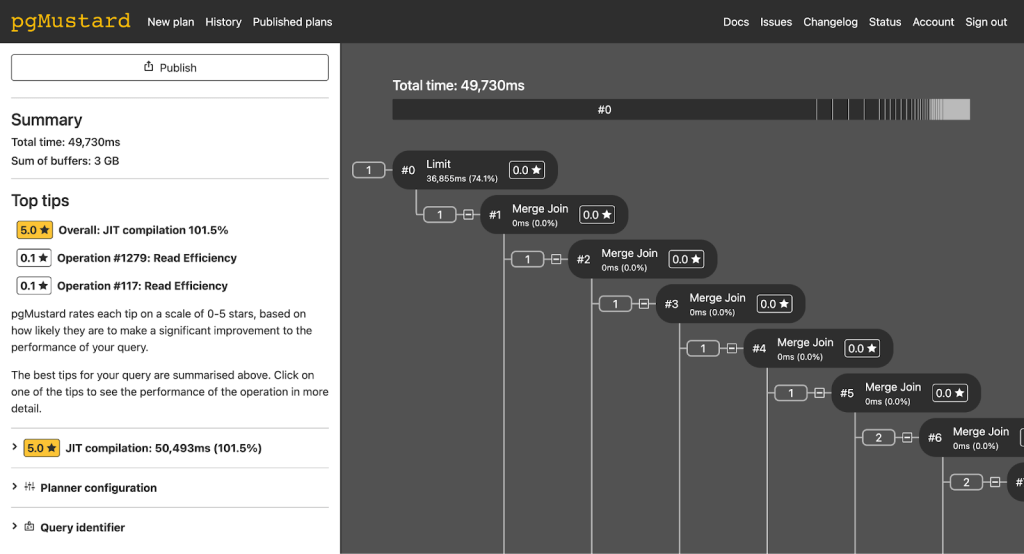
- pgMustard – this has proved to be a very useful tool in general, and worth a slight digression. Once you’ve identified a slow query, it can help explain why it’s slow and what you might do about it. Other ‘explain’ tools like explain.depesz.com can do a similar job.
It was after the main investigation, but one thing we found was that a particularly slow query in a different area was taking 50 seconds to run, the vast majority of which was caused by ‘just in time (JIT) compilation’. After disabling this option, query time reduced to 3 seconds.
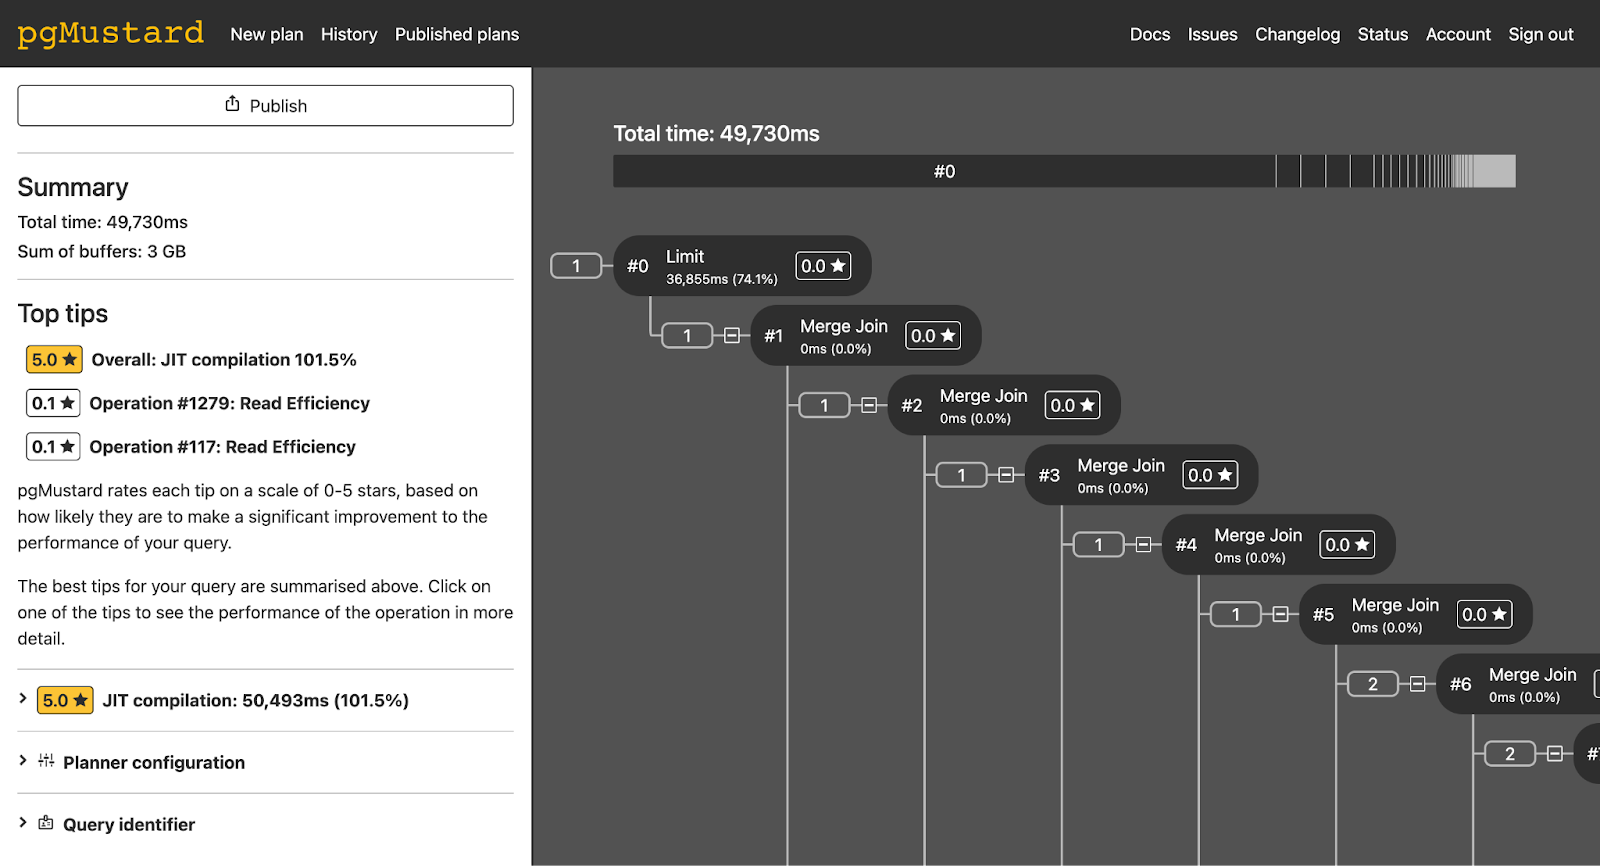
(That’s an option I never would have thought to check, but disabling it globally immediately reduced load on the database by about 50%).
We now plan to add in the facility to send plans to pgMustard directly from Agilebase. Note as previously mentioned, Agilebase views can be quite complex and the raw output of the EXPLAIN command required by pgMustard for this example was almost 3GB, requiring some pre-processing, e.g. to remove whitespaces before uploading.
Anyway, in our case we formed a suite of hypotheses.
- There’s been a lot of work done over the past year or so to integrate third party applications for this customer, using the API, so a first thought was to look here. However this was ruled out quickly as there had been no change in usage patterns prior to the issue.
- The problems first occurred between 9 and 10am in the morning. The customer is a heavy use of view caching – many views update every 24 hours. Recent releases of Agilebase allow you to choose the time of day this happens for each view and defaults to a random time, but earlier versions defaulted to running them all at the same time, sometime between 8 and 10am. A lot of views created a long time ago had been left at this time, resulting in a high load spike.
Altering all these views to run at different times overnight helped to reduce this, but there were still intermittent problems.
- That caching mentioned above is woven into the customer applications quite deeply. In many cases, a cached ‘calculations’ view has many other customer-facing views joined to it, which may themselves have others joined, resulting in a whole tree of dependencies. Some cached views are set to update not once every 24 hours, but on demand, as soon as data they depend on changes. So there can be quite a lot of cache refreshing going on.
Now when a Postgres cached view is refreshed, it normally blocks access to other users who want to look at the view, until the refreshing is complete. This is different to the normal behaviour for a view, when many people can query it simultaneously. Not only the view itself will be blocked, but also any others in that tree which reference it.
So that could cause a large issue. To solve this, ‘concurrent’ refreshing can be enabled. That’s slightly more complex to set up and required code changes to the Agilebase codebase itself, so couldn’t be done immediately. However the work has now been completed. - It was found that a particular problem was caused by a daily ‘cleanup’ workflow which deleted rows that weren’t needed any more, from a table containing tens of millions of rows. Due to an oversight, rows had been building up in this view, unable to be processed due to dependencies on other data, but the workflow was still running and using resources. Compounding this, it was running every 5 minutes, rather than only once a day as was necessary.
Those two factors were fixed, the workflow again being set to run overnight.
Whilst looking into this one, we found an additional resource hog in the code – when deleting a record, Agilebase recurses to also see if dependent records need to be deleted. Each recursion was opening another database statement, leaving the former one open. Hence a number of database statements could be left open simultaneously, using resources and potentially blocking other actions. That bug has now been fixed. The high number of locks held for a transaction, as reported by pg_top (above) prompted us to find that out.
- It turned out that the most significant factor however was caused when a particular person created a customer order record in a particular part of the system. When a customer order is created, a multi-stage workflow is run, to take actions such as adding in regular order items, attach the order to the correct delivery site etc. One of these workflows was taking an inordinately long time. Adding an index to one of the tables used solved that.
So in this case, there were a couple of different causes and solutions, not one ‘clean fix’. The good thing though is that the resulting improvements to Agilebase will benefit everyone and make the platform increasingly robust and able to scale to large workloads.
Future improvements
Improved monitoring
As mentioned above, there is detailed audit trail data in Agilebase from which you can gather usage patterns and highlight slow queries. However, it was clear a built-in ‘quick overview’ of problems would be useful, allowing an Agilebase software architect to see a count and list of any views with errors attached. That would
- show the scale of a problem
- immediately show which areas are affected
Work to produce that is in progress and the first fruits of that labour (error counts) can be seen in the developer interface now.
Advice
We will be introducing a way to ensure a client moves to the best Plan for their needs at the right point in their journey. In the case above, we have two billing plans, D and E, for companies with larger usages and enterprises, these come with the option to run Agilebase on your own dedicated server (provided in the cloud). Moving to one of these plans means, as well as having their own dedicated ‘computing resource’, that should they ever need to reboot the system, they can do so quickly themselves without being reliant on us and our processes (we need to follow a process that mitigates the impact on other customers).
Summary
Following initial mitigations, the whole process took a couple of full days of investigation, plus some time later on to implement some of the updates that required code changes to Agilebase (going through the usual QA process etc.) and ongoing work to progress further improvement ideas that have resulted.
We’re deeply appreciative of our customer’s patience and understanding during the process. We feel lucky that we have good enough relationships with our customers to have constructive discussions during rare occasions like this.

Leave a comment