A quick pointer to a new addition to the charting options for agileBase views and dashboards. Stacked bar and area charts can now be produced:
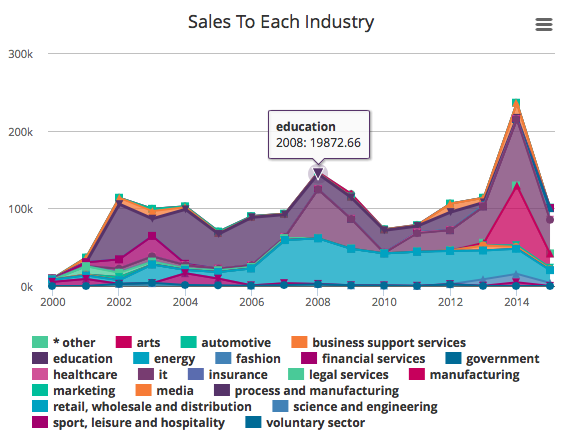
To use this, first create a chart as normal by selecting the x-axis and y-axis, then choose a field using the ‘breakdown’ option. If the field you want to break down by isn’t in the list, use the ‘view’ tab to add it to the current view.


Leave a comment